Status: [DRAFT]
Table of contents
Open Table of contents
Introduction
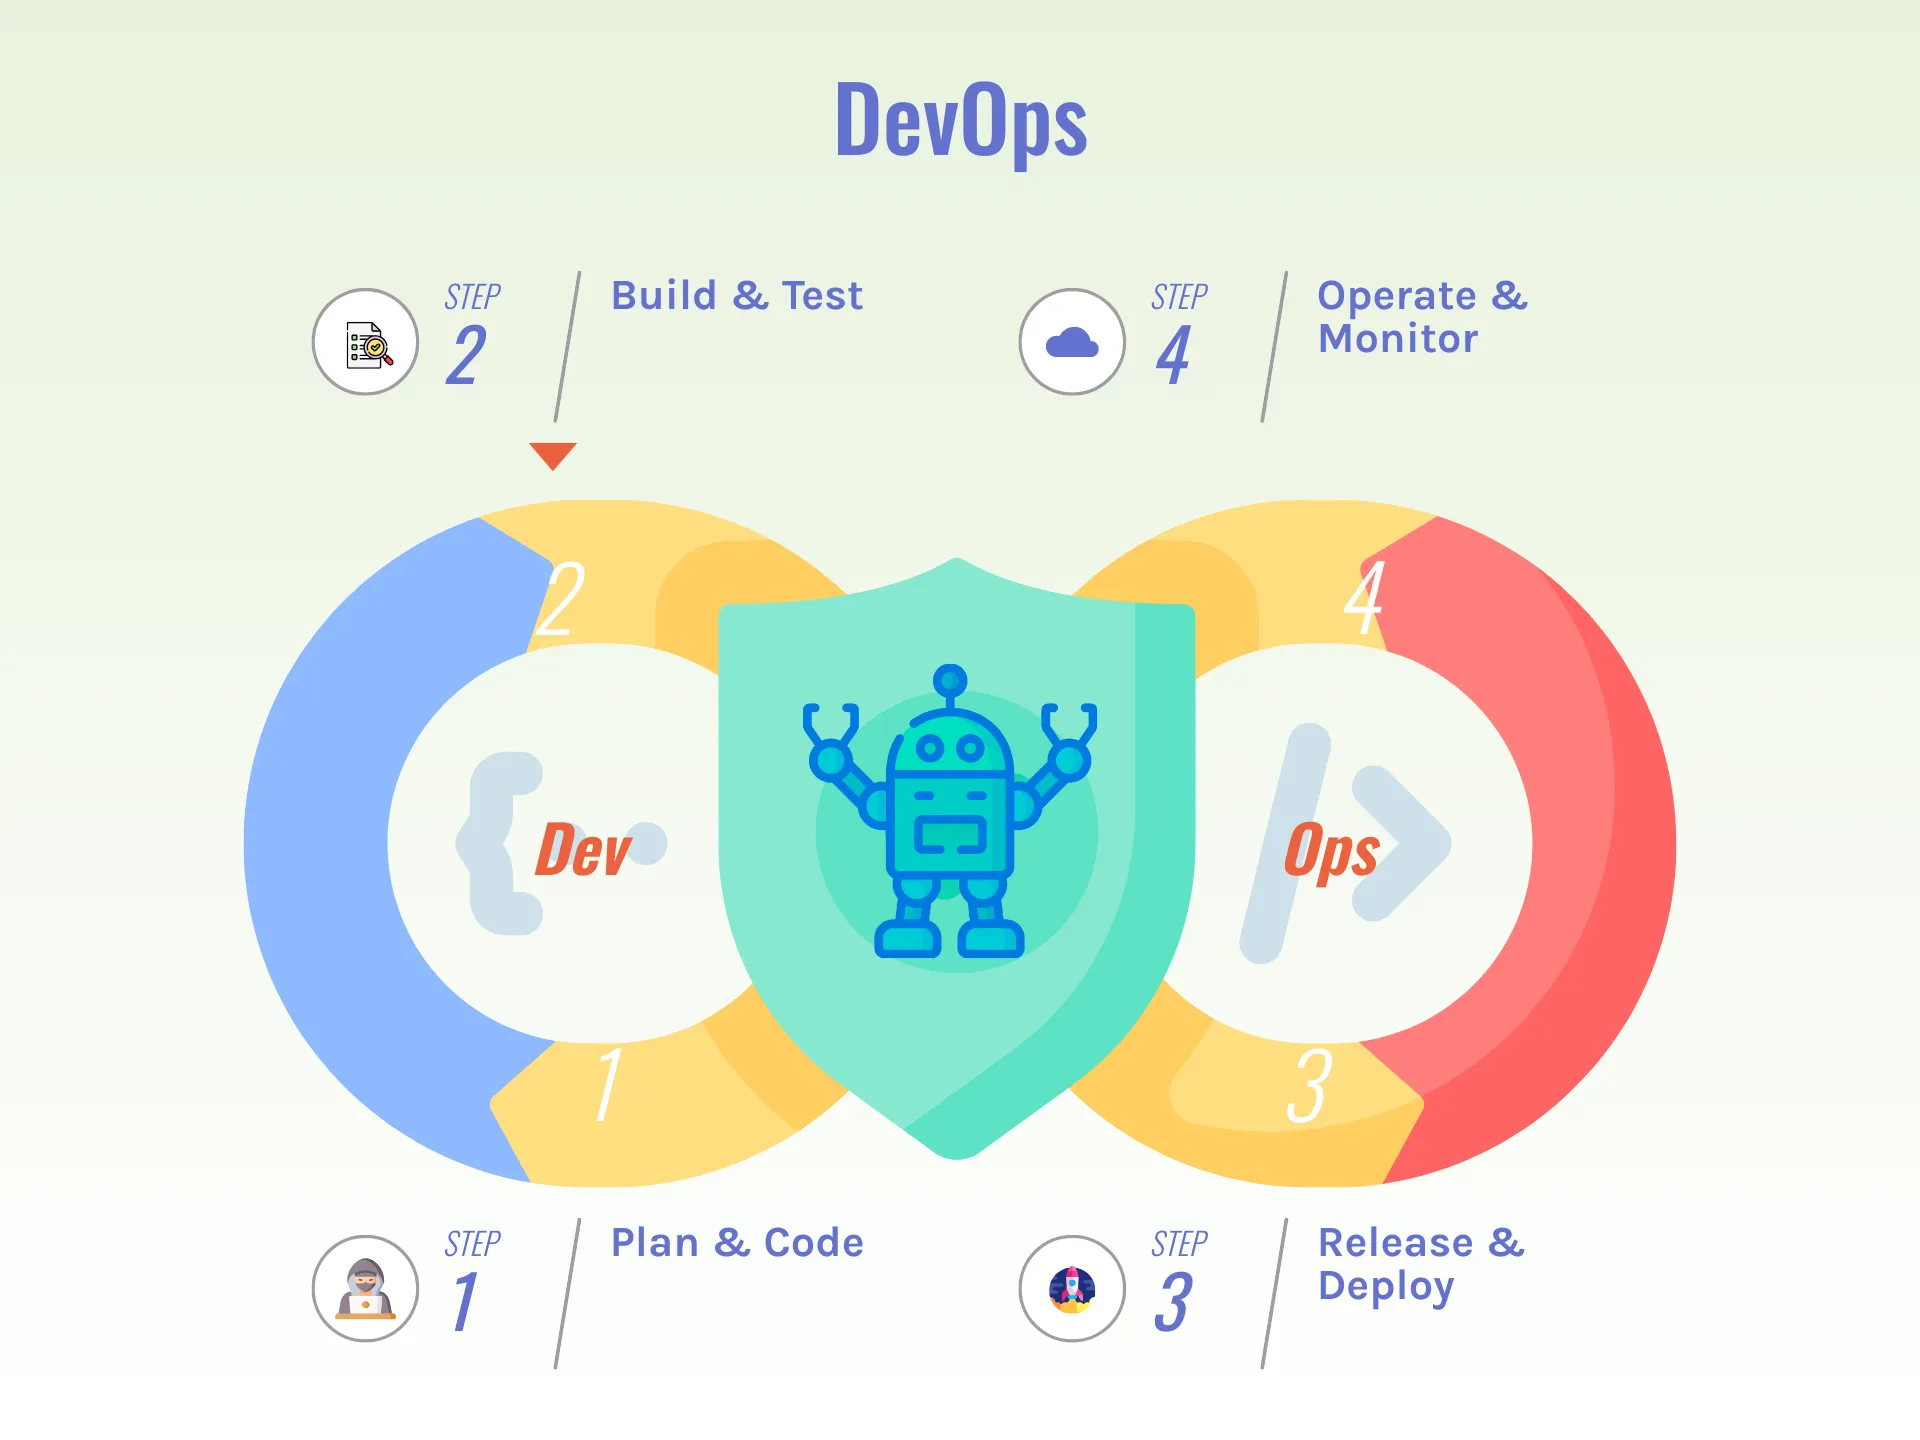
The DevOps cycle represents a set of practices and processes that facilitate continuous delivery and integration of software, ensuring efficiency and reliability in development and operations. In its purest form, it has eight key phases: Plan, Code, Build, Test, Release, Deploy, Operate, and Monitor. This continuous loop ensures efficient and reliable software development and operations. Every iteration begins with preparations and planning to define objectives and requirements, followed by coding and building the software. The new versions are then tested rigorously to ensure quality before the software is released and deployed to production. Once deployed, the software is operated and continuously monitored to maintain performance and address any issues or unexpected failures. This iterative process promotes agility, collaboration, and rapid delivery of high-quality software systems.
In recent years, a significant amount of research and development has been focused on defining methodologies, team topologies, and enterprise integration patterns to ensure successful execution of the DevOps cycle within product teams. These teams are typically composed of numerous small groups, each contributing to one or more of the phases, ensuring a seamless transition between issues and responses throughout the project lifecycle.
What is Generative AI
Historically, AI was used to understand and recommend information. Now, generative AI can also help us create new content. Generative AI refers to deep-learning models that can generate high-quality text, code, images, and other content based on the data they were trained on. Generative AI builds on existing technologies, like large language models (LLMs) which are trained on large amounts of text and learn to predict the next word in a sentence. For example, “peanut butter and ___” is more likely to be followed by “jelly” than “shoelace”.
— Reference: Google Gimini
Introducing Generative AI into your DevOps cycle can offer several benefits and further enhancements to your process. Starting from where it ends, in the Monitoring phase, your events, service logs and alerts could be analysed to monitor performance, detect anomalies, and report potential issues before they become critical. In the same sense, there are lots of AI powered services to assist your team during the Planning & Coding phases; for example if your change management system is integrated with these tools, they will be able to read, understand and propose possible changes/ solutions to the raised issues inside tickets. The assisted coding experience is also another valuable resource which could help patching and fixing bugs at production faster. In Build & Test phase, generative AI or trained models can automate and enhance testing procedures to provide higher accuracy and faster feedback loops. Furthermore, your CICD pipeline should rely on autonamous agents to review release candidates and bridge the gap between the release and deployment time.
From Workload Insights To Intelligence

In today’s dynamic IT environments, monitoring your operational parameters is a crucial step for maintaining system health and ensuring a stable workload status. Having an AI-driven method to meet this objective can greatly expand your monitoring capacity. This is possible because this approach allows you to analyse your system logs and unexpected failures in a scalable way. And by following this approach, you could open new doors to a range of new possibilities, namely faster RCA (Root Cause Analysis), identification of common errors and there causes, a self-operating process to respond to your runtime changes, etc. In this post, I will use a simplified and high level definition (as shown in Figure 2) as the example application model and then demonstrate how we can accomplish this goal in the given example. I will provide some context and will give you an overview of the abstract stages of the whole process so that you can easily map the steps to your preferred setup and customise it to fit your needs. I will also share some implementation hints, mention a few things that you could avoid and finally, I will highlight the key points of the process and their relationship so that you could read further about them in various sources.
Overview
Th process involves four key stages:
- Operate: Collecting and aggregating logs, traces, alerts, events etc.
- Monitor: Streaming data for real-time analysis.
- Analyze: Utilizing AI to detect anomalies and perform assisted analysis.
- Automate: Executing guided responses based on predefined playbooks and generative AI.
[Contd]
Components
-
Data Sources:
- CloudWatch Alarms: Set custom alarms for specific metrics.
- CloudWatch Event (Event Based): Capture specific events from AWS services.
- CloudWatch Logs: Centralize and monitor log files.
- CloudWatch Metrics Insights: Gather insights from various metrics.
-
Data Streaming:
- Amazon Kinesis Data Streams: Capture, process, and analyze real-time streaming data.
- Amazon Kinesis Data Analytics: Perform real-time analytics on streaming data.
-
AI Integration:
- AI Platform: Utilize machine learning models and algorithms to detect anomalies.
- AWS Bedrock: Enhance AI capabilities with pre-trained models and custom solutions.
-
Automation and Response:
- Runbook Store (GitHub): Store and manage automation scripts and runbooks.
- AWS Systems Manager: Execute runbooks and manage automation tasks.
- Integration Tools: Use tools like Slack and JIRA for notifications and ticket management.
Implementation Steps
-
Set Up Data Sources:
- Configure CloudWatch Alarms for critical metrics.
- Set up CloudWatch Event rules to capture important events.
- Enable CloudWatch Logs to centralize and manage log files.
- Use CloudWatch Metrics Insights to derive actionable insights from collected metrics.
-
Stream Data with Amazon Kinesis:
- Create Kinesis Data Streams to capture real-time data from CloudWatch.
- Set up Kinesis Data Analytics to analyze the streaming data in real time.
-
Integrate AI for Analysis:
- Deploy an AI platform to analyze the data streams for anomalies.
- Use AWS Bedrock to integrate advanced machine learning models for more accurate detection.
-
Automate Responses with Runbooks:
- Store your automation scripts and runbooks in a GitHub repository.
- Configure AWS Systems Manager to execute runbooks based on AI analysis results.
- Integrate with Slack for real-time notifications and JIRA for automated ticket creation and management.
Example Use Case
Let’s consider a scenario where your server logs indicate a spike in error rates. The system would:
- Detect the Spike: CloudWatch Logs and Alarms capture the increase in error rates.
- Stream the Data: Data is streamed to Amazon Kinesis for real-time processing.
- Analyze with AI: AI models identify the spike as a potential issue.
- Trigger Automation: A runbook stored in GitHub is executed via AWS Systems Manager to restart the affected service and notify the relevant team through Slack and create a JIRA ticket for tracking.